Size Matters
That time I ignored a profiler for five weeks
Published 2021-07-08 | 8 Minutes Long | 1708 WordsDisclaimer: This is something between a rant and a warning, so don’t come expecting a coherent masterpiece of literature. This was written out of the pent-up rage of fighting the second most tiring performance-centric debugging stint I’ve ever dealt with.
First off, let’s explain some background. DDShow is a profiling, debugging and visualization tool for Timely and Differential Dataflow programs. These programs have built-in logging harnesses which are capable of sending various messages about the state of things within the program.
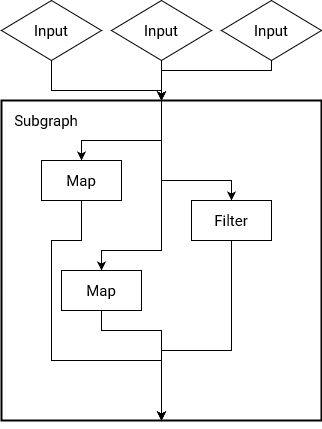
Timely is based on the dataflow programming paradigm which centers around representing
programs as graphs of “operators” with data flowing between them. This is a really cool
way of looking at programs, but I’ll save that for another day. In order to allow anyone
looking at timely’s logging messages to reconstruct the dataflow of the program themselves,
timely has the OperatesEvent and ChannelsEvents log messages. An OperatesEvent tells
you about the existence of an operator and where it lies within the dataflow graph. This
information is communicated by one of the fields within an OperatesEvent, addr. Likewise,
ChannelsEvents have a src and a dest which tell you which operators the given channel
connects as well as a scope_addr which tells you what scope the channel (and the operators
it connects) are in.
struct OperatesEvent {
    addr: OperatorAddr,
    // ..snip
}

struct ChannelsEvent {
    src: OperatorId,
    dest: OperatorId,
    scope_addr: OperatorAddr,
    // ..snip
}
And this is where things start to get complicated.
Within ddshow I connect operators and channels together, which at first glance you’d think
could be done by simply appending each channels’ src and dest to its scope_addr and then
comparing it against all channels’ addresses.
OperatorEdges(src, dest) :-
    OperatesEvent(src),
    ChannelsEvent(src_id, dest_id, scope_addr),
    [..scope_addr, src_id] == src,
    OperatesEvent(dest),
    [..scope_addr, dest_id] == dest.
And you’d be right, to an extent. However, the reality of timely’s dataflow graphs is more complicated than this and the name of that complication is scopes. I mentioned scopes earlier but I didn’t really touch on them, so now I will.
Timely supports cyclic dataflows, which is a really fancy version of the loops you’d use
within everyday programming. Timely allows its data (held within streams) to iterate and
build upon itself which can be a really difficult thing to do for streaming systems. Timely
handles all of this complexity within scopes, which are just a sub-graph (a graph within
a graph) of the larger dataflow. These scopes have some special rules when it comes to
operator addresses which make it a little more difficult to deal with: if a channel has
a source id of 0 then it connects to an input of a scope and if a channel has a
destination id of 0 then it connects to the output of a scope. Alright, but why do we even
need to care about this, can’t we modify the connection algorithm we wrote above to chop off
the zeroes and then just let the graph library we use do its thing?
So technically yes, but you lose a lot of information from this (not to mention that “state of the art” graph layout programs like graphviz choke on any vaguely complex graphs like this). Well, I guess we’ll do this the right way (what a chore) and connect things with these entrance and exit addresses.
// Get all the operators connected directly to each other
OperatorEdges(src, dest) :-
    ChannelsEvent(src_id, dest_id, scope_addr),
    src_id != 0 && dest_id != 0,
    OperatesEvent(src),
    [..scope_addr, src_id] == src,
    OperatesEvent(dest),
    [..scope_addr, dest_id] == dest.

// Get all operators connected to an scope's input
OperatorEdges(src, dest) :-
    ChannelsEvent(src_id, dest_id, scope_addr),
    src_id == 0 && dest_id != 0,
    OperatesEvent(src),
    scope_addr == src,
    OperatesEvent(dest),
    [..scope_addr, dest_id] == dest.

// Get all operators connected to an scope's output
OperatorEdges(src, dest) :-
    ChannelsEvent(src_id, dest_id, scope_addr),
    src_id != 0 && dest_id == 0,
    OperatesEvent(src),
    [..scope_addr, src_id] == src,
    OperatesEvent(dest),
    scope_addr == dest.

// Get all operators connected to an scope's input and output
OperatorEdges(src, dest) :-
    ChannelsEvent(src_id, dest_id, scope_addr),
    src_id == 0 && dest_id == 0,
    OperatesEvent(src),
    scope_addr == src,
    OperatesEvent(dest),
    scope_addr == dest.
Well, we’ve now quadrupled our complexity but this is still manageable, and it does indeed work… for the most part. However, what happens if we try this with a dataflow graph that has an operator connected to an operator within a scope which is within a scope?

Crap, now we’re now back where we started.
As an aside, it actually took me a long time to figure out this little bug was occurring, which was not a fun thing to learn.
How do we then address channels that drill down into nested scopes? Well, we do it via some iterative scopes of our own! I’m not going to write out the code here, but we basically build up a list of subgraphs, iterate on our proposed collection of operator connections and then grab any that are still connected to subgraphs somewhere and continue trying to connect them.
And there lies the crux of the issue that I relentlessly threw myself against for nearly five weeks: This process of connecting operators together via channels is an iterative scope. An iterative scope in and of itself isn’t a problem, however some additional changes I made to ddshow all accumulated to make a sweltering hellhole that would make Dante proud.
The first of these changes that I made was to partition logging events by the worker that they came from. In timely each worker thread (or process) gets their own worker id which they attach to each log message they make. My idea was that by separating log events by worker I would be able to build up a picture of what each worker was doing at any given time, however during my refactor adding this I also changed my operator connection code to utilize this partitioning. I believe that this was the core issue, and let me explain why.
As of now, the iterative part of my operator connection code has exactly two joins which are both
in essence cartesian joins. This is normally a bad thing that you should try to avoid since each
cartesian join is O(n2). This isn’t usually a problem, but now with the addition of partitioning
each collection by worker we also made ourselves repeat the whole operator connection computation for
each worker. That isn’t the worst thing though, when we partitioned our collections we actually increased
the join cardinality by that much as well. To connect up the dataflow graph of a computation that has
100 channels and 4 workers we went from a rough join cost of 1002 * 2 = 20,000
(without keying things by worker all of the operators and channels get deduplicated) to one that now
had a rough cost of (100 * 4)2 * 2 = 320,000. It actually gets worse once
you take into account the logic for nested scopes, but the very first join is the best case scenario
and it has a nearly 1,500% performance degradation. Stopping right here, this means that where a
dataflow graph once took 10 seconds it would now take nearly three minutes to run. In short, this is bad.
Note that while in this 10 seconds to three minutes case it’s not an end of the world situation, however for me once everything was compounded a (previously) five second computation was taking a little over an hour to complete.
There were other little bugs and things elsewhere that made performance worse but by and large this was the biggie. The rest of the problems that I faced were, in retrospect, simply consequences of the kinds of flailing that you do when you’ve been working on a problem without progress for too long. Desperate code never helps anyone, so instead of writing weird stuff that doesn’t make sense, just go take a break and eat a nice meal.
Near the beginning of this I said that I ignored a profiler for five weeks, and I most definitely did. I managed to run ddshow on itself and it continually told me that the issue lay within this scope connection algorithm yet I completely ignored it. I had convinced myself that the problem was in other components and so that’s where my late nights and migraines were spent, fruitlessly troubleshooting something that had no trouble at all.
In short, listen to your tools. Yes, they’re wrong sometimes but even wrong data can show right trends. Even if it seems improbable to your over-caffeinated brain maybe just take a glance at the code it’s pointing to, the worst that could happen is that you rule out another suspect. When working with relational systems, pay attention to the potentially problematic sections, cartesian joins can be mitigated but they’re never truly tame, they’ll wait until you have a pressing deadline at work to rear their ugly heads.